

Drone Gamma-Ray Spectroscopy
Drone gamma-ray spectroscopy is the deployment of a gamma-ray (γ-ray) spectrometer (detector) on a drone (UAV) to detect gamma radiation (radionuclides) from the top 50 cm of soil or surface layer. Putting it in very basic terms, the system can produce a spectrum profile for a given soil or sediment that will provide distinct levels of potassium (K-40), thorium (Th-232) and uranium (U-238). In essence, the detector provides data that allows geophysicists to create a γ-ray profile of natural sediments and identify distinct spectral peaks.. In layman’s terms, we can say that these peaks provide the geophysicist with a unique fingerprint. Consequently, geophysicists can use these fingerprints to identify correlations with the target of interest.
Putting it Simply
The gamma-ray detector is a passive device and simply counts the radionuclides that enter the system chamber. Depending on the resolution of the detector system, concentrations of the different radionuclides are possible using various techniques, i.e., by photo-peak analysis or full spectrum analysis (FSA).
Drone Gamma-Ray Detectors Utilise Scintillation Crystals
For field mapping, applications require a γ-ray detector with a response high enough to obtain sufficient statistics to identify individual nuclide activity concentrations of natural soil, rock or sediment in about 10 seconds. Moreover, the system should be able to withstand rough conditions out in the field. Scintillation crystals are often chosen because they deliver the best balance of performance and durability. Surveyors have used natural γ-radiation measurements in boreholes, airborne surveys, seafloor mapping, and drone-based surveys for many years. In most of these cases, surveyors use NaI (sodium iodide) scintillation crystals. These crystals have a combination of properties that make them appropriate for many of these applications. Specifically, they are available in large formats, provide a moderate resolution and operate effectively at normal temperatures. Medusa detector systems use NaI scintillation crystals.
Passive Detection
An important aspect to remember is the passive nature of the Medusa detector. To keep things simple, the size of a detector determines the accuracy of the measurement. Like a photo camera, the quality of the “image” depends on the amount of radiation (“light”) seen by the sensor during a certain amount of time (live-time, i.e., “shutter speed”). A larger detector will “count” more gamma rays in the same time period than a smaller detector. This means that the smaller the sensor, the longer you will have to measure to get the same data quality.
Drone-based Best Practice
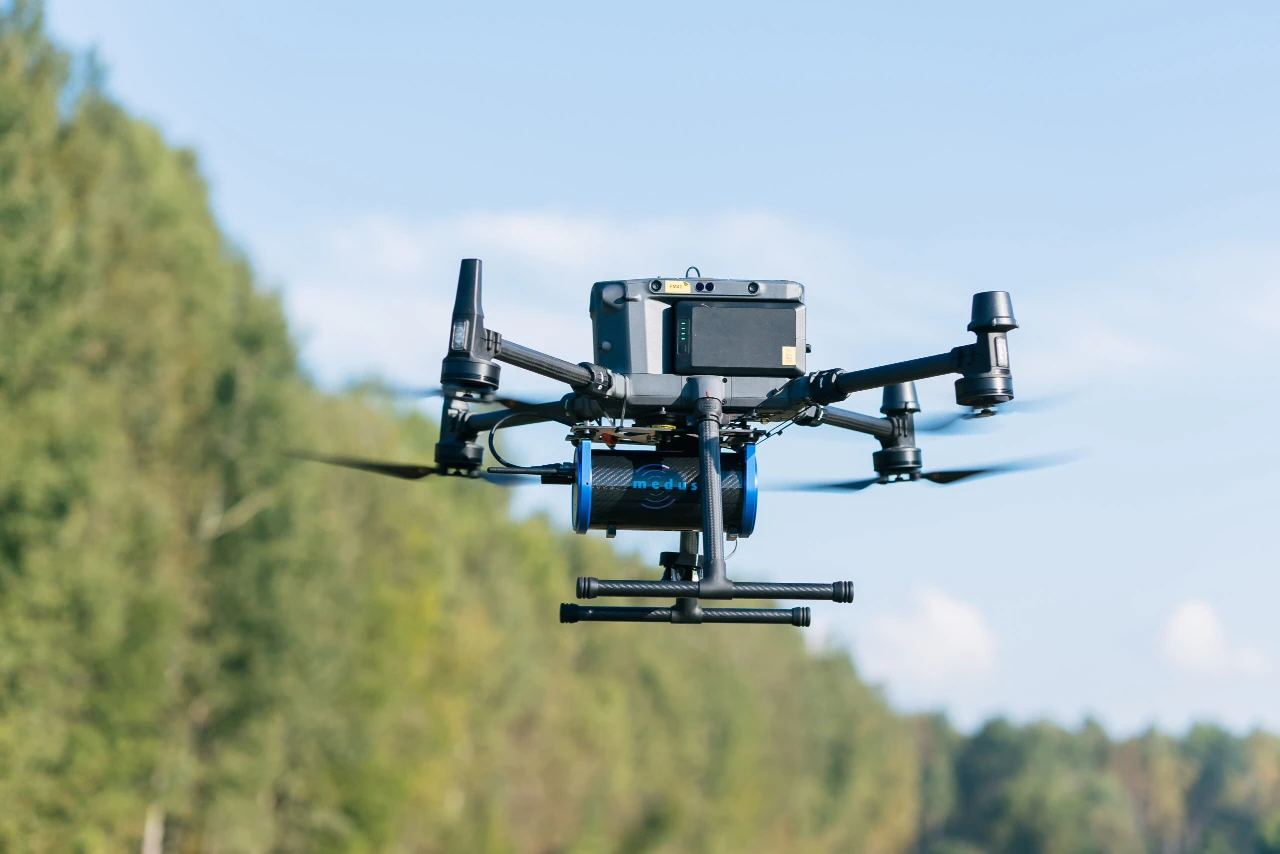
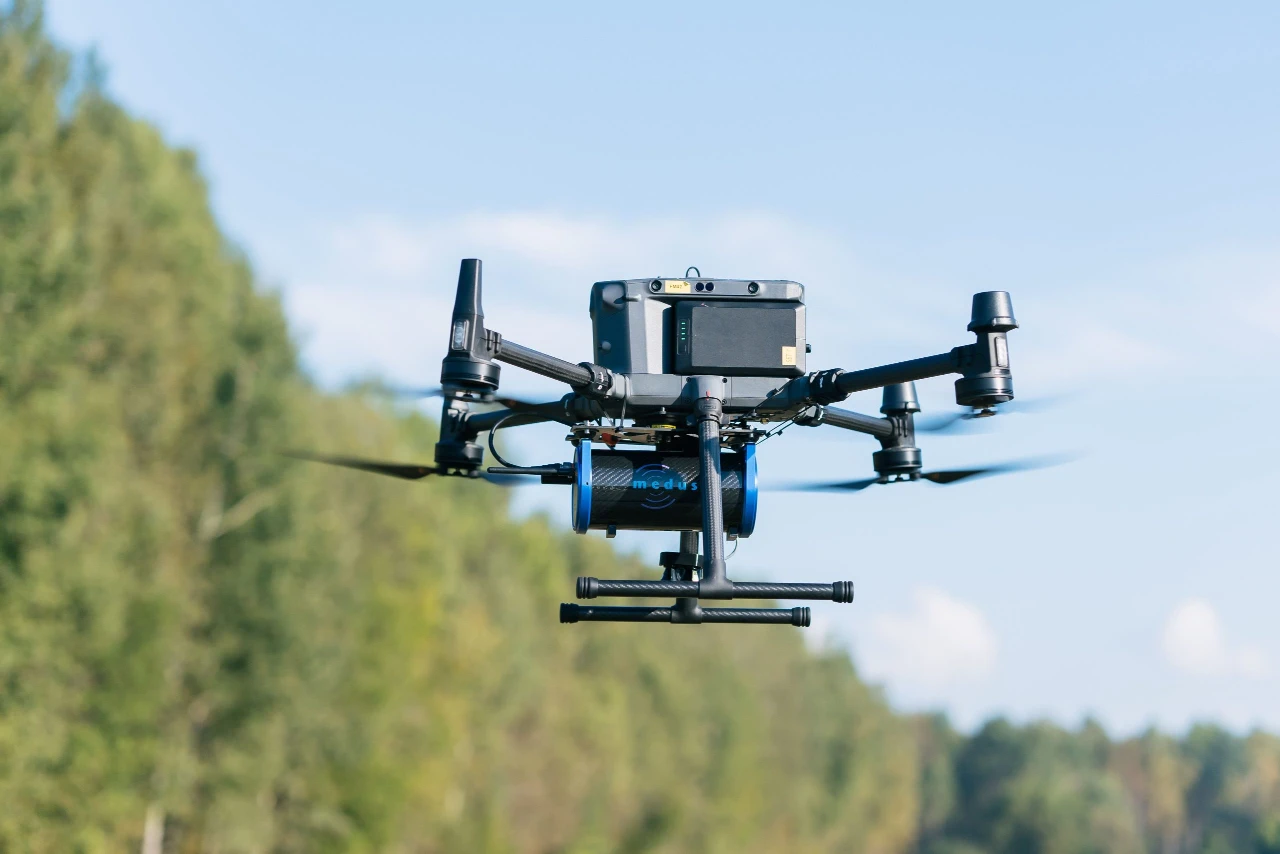
The gamma spectrometer can be mounted under various UAVs, but a very accessible solution for commercial users includes the DJI M400 and the MS-350. Operators should maintain an adequate battery supply for a full day of surveying. Larger drones like the DJI M400 are able to carry the MS-700 and can survey for over 30 minutes. In the case of the DJI M350RTK, expect around 25 minutes on a single set of batteries whilst carrying the specifically designed MS-350 detector.
Drone Gamma-Ray Survey Planning
When a gamma-ray spectrometer is mounted under a drone (UAV) and brought into the air, the measured signal will change. Airborne deployment attenuates the signal and changes the measurement footprint. Therefore, these effects will determine the flight settings. Most surveys we do with drones are flown at elevations between 5m and 30m. The higher, the larger the groundspot/footprint (the lower the resolution) and the bigger the absorption effects by air. As a rule of thumb, the radius of the ground spot is more or less 2 times the drone’s elevation. This means that at 5 m height and a line spacing of 10 m, the survey samples all soil within the target area. Increasing the flight height reduces the number of detected counts and, therefore, lowers measurement accuracy. Operators can overcome this loss in counts by increasing the size of the detector or flying slower.
When it comes to acquisition speed, i.e., for a smaller detector, we recommend scaling the acquisition speed with the volume of the sensor. The acquisition speed of an MS-350 will then be 0.1 Hz. This means each spectrum has a live time of 10s.
The line spacing determines the spatial resolution of your final map. A line spacing for mapping farmland is in the range of 10-20m. The maximum spatial resolution depends on the source area of the radiation detected by the spectrometer. The figures below illustrate the increase in the origin of radiation with increasing detector height. Therefore, survey planners should choose a line spacing equal to the radius containing 65% of the detected radiation.
Medusa Explorations
Our partners at Medusa support JBUAS with their consultancy business called Medusa Explorations. They offer expert advice and solutions in geoscience with a practical approach: making scientific knowledge available to the geo-related industries. Medusa Explorations achieve this by conducting surveys, generating maps and developing applications for geophysical sensors such as gamma-ray spectrometers. In addition, the experts at Medusa Explorations also offer specialised data analysis services for radiometric mapping, ground-penetrating radar and EMI. This entails processing and interpreting geophysical data and due diligence of these data sets. Their interpretation includes mapping for hydrology, soil structure, soil and sediment contamination, and minerals (including critical metals like gold, silver, lead, etc.).
Medusa Explorations engage with JBUAS very early in projects and enable a full plan of action to be sequenced. Their expertise in pedometrics enables JBUAS customers to benefit from a wrap-around service:
- Geology insight
- Technology selection & calibration
- Application model development
- Flight plans (height, line spacing, sample rate, etc.)
- Analysis and Interpretation
- Reporting
If you think your organisation could benefit from this kind of expert support, get in touch via our contact page.

Drone-based Gamma-Ray Detector Applications
There are a varied number of applications for where this technology could be the right tool in the toolbox. Here are a few of the more well-known applications:
- Sand and clay distribution studies for crops and conservation studies.
- Soil moisture studies for agriculture.
- Peat thickness studies.
- Mineral exploration: gold, diamonds, uranium, lithium, porphyry copper, carbonatities, VMS, SEDEX.
- Radon gas mapping for quarries and housing developments.
- Assessment of dredged or in-situ exposed river/estuary bed for heavy metals and organic compound contaminants.
- Dioxin contamination in clays: rivers/estuaries (often due to chemical spills at harbour operations).

Application Models
Application models translate radionuclide concentrations into the parameters of interest. In most of our applications, the concentrations of radionuclides serve as a proxy, and most parameters are derived indirectly, while only a small number can be measured directly.
The utilisation of gamma-ray sensors for soil mapping purposes is a common practice in the field. The most frequently measured radionuclides include naturally occurring ones such as 40K, 238U, and 232Th, as well as man-made radionuclides like 137Cs, which are often byproducts of fission reactions. Specialists use application models to convert radionuclide measurements into meaningful soil properties.
Pedometrics
Scientists refer to the discipline that develops and refines application models for geophysical sensors as pedometrics. This branch of study explores the various methods and techniques involved in interpreting sensor data to derive accurate and reliable information about soil characteristics. By harnessing the power of pedometrics, researchers and professionals in the field of soil science are able to make informed decisions and gain a deeper understanding of soil properties through the use of gamma-ray spectrometers and other sensing technologies.

Pollution levels accurately mapped using a gamma-ray detector
Case Study – Insight into Agriculture
Farming starts with a proper understanding of the soil. Most farmers globally know the composition of their fields but also look for methods that can precisely map the composition of their soils for applications, as in precision farming of the selection of proper crops for their fields. This approach has been used by farmers with larger fields and using precision farming, but also by farmers that turn into biological farming. A European project on improving marginal Spanish soil showed this application.
Gamma-ray spectrometry has become a valuable tool for precision agriculture, particularly for assessing soil characteristics that directly impact crop yield and soil health. Extensive research has established its effectiveness in mapping various soil properties, ranging from physical properties such as clay content, cation exchange capacity (CEC), soil moisture and soil organic carbon (SOC), and chemical properties such as pH and plant-available phosphorus (P), magnesium (Mg) and potassium (K).
Case Study – Soil Texture
Dutch Wageningen University & Research has embraced the gamma-ray spectrometer approach to enhance the precision of field sampling, particularly in heavy-loamy soils. Researchers conducted a preliminary site scan to aid in the planning of soil coring operations, focusing on the need for clay content information in these heavy-loamy soils, using a gamma-ray detector before any coring took place. A regional calibration model, developed from datasets obtained in previous projects, converted radionuclide measurements into accurate estimates of clay content. This preparatory step was essential for optimising the coring strategy by pinpointing areas of interest based on their clay composition. Afterwards, researchers compared the predicted and actual clay contents in detail to evaluate the accuracy of the pre-scan predictions. Remarkably, the predicted lutum (clay) concentrations exhibited a mere 0.5% deviation from the results obtained through laboratory analysis of the core samples.
Case Study – Gold Exploration
Gold deposits are formed by hydrothermal processes and are often associated with minerals such as pyrite, sericite/illite, alunite, adularia, kaolinite, muscovite, and magnetite. For chemically altered hydrothermal deposits that are typical for orogenic gold systems, the alteration often introduced high amounts of potassium. Since uranium is generally mobile, the U/Th ratio will be low for these deposits. For shear and fault-zone (Au-quartz vein) deposits, airborne radiometrics can help to delineate lithologies and find associated faults and shear zones. At a deposit scale massive quartz veins are often associated with alteration (potassium highs). Regional potassium highs associated with felsic volcanism and local potassium highs with corresponding low Th/K associated with potassic alteration can be used for epithermal styles of mineralisation. Radiometrics is a powerful tool in detecting gold as well as other critical minerals.
Case Study – Contamination of Soils and Sediment
Contamination of sediments in lakes, rivers and harbours by heavy metals and organic compounds (including polyaromatic hydrocarbons (PAHs) and PCBs) is an important environmental and economical concern in many countries. Health risks associated with these pollutants may restrict activities like fishing and recreation. Moreover, to maintain access for shipping, most waterways and harbours are routinely dredged. An essential waypoint in the management and disposal of such contaminated dredged sediments is their classification on the basis of the degree of pollution.
Surveyors can measure radionuclide concentrations in situ; therefore, these measurements can be used as a proxy for contaminants. An application of this model uses the correlation between concentrations of heavy metals and organic micro-contaminants with naturally occurring and anthropogenic radionuclides to make synoptic maps of the degree of contamination of extended areas. The method uses measurements collected by a gamma-ray scintillation detector that survey teams tow behind a vessel or mount on a land vehicle.
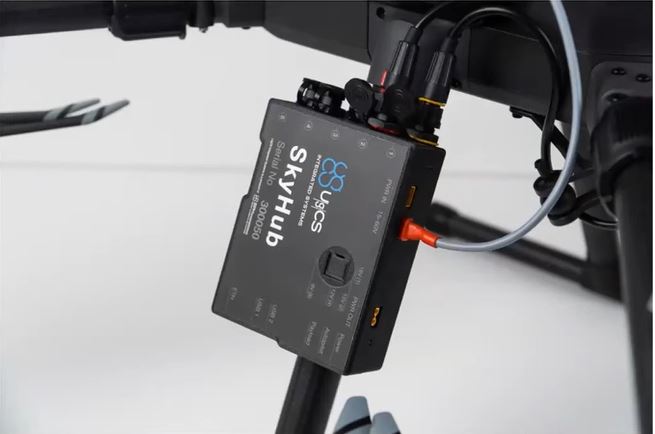
UgCS SkyHub & UgCS True Terrain Following (UgCS TTF)
The UgCS SkyHub solution is a hardware and software set designed to enhance UAV capabilities for commercial gamma-ray surveying purposes. In essence, it is the onboard computer that is at the heart of your UgCS drone-based geophysical sensor system. Furthermore, for maintaining an accurate AGL (flying height above ground level) for your drone and gamma-ray sensor (getting an accurate height is critical to ensure good results), the True Terrain Following Feature (UgCS TTF) and the UgCS Obstacle Detection Radar (UgCS ODR) work with the UgCS SkyHub onboard computer in complete harmony.
For more information on the SkyHub, TTF or ODR systems, click here.